Trading successfully in the forex market requires more than intuition; it relies on tools that provide insight into price movements and market trends. The best trading indicators forex help traders make informed decisions by analyzing historical and real-time data. These indicators identify trends, measure momentum, and signal potential entry and exit points, giving traders an edge in the highly volatile forex environment.
What Are Forex Trading Indicators and How Do They Work?
Forex trading indicators are mathematical calculations applied to price and volume data to predict future market movements. They transform raw market data into actionable insights, helping traders anticipate trends, reversals, and market momentum. Indicators can be categorized as trend-following, momentum, volatility, or volume-based, each offering unique insights into market behavior.
Why Are Indicators Critical in Forex Trading?
Indicators are essential because forex markets can be unpredictable and fast-moving. They allow traders to:
- Recognize trends and avoid trading against them
- Identify potential reversals for optimal entry and exit points
- Measure market volatility to adjust risk and position sizes
- Combine multiple signals to improve probability of successful trades
Without reliable indicators, trading decisions often rely on guesswork, increasing the risk of losses.
Which Indicators Are Considered Trend-Following?
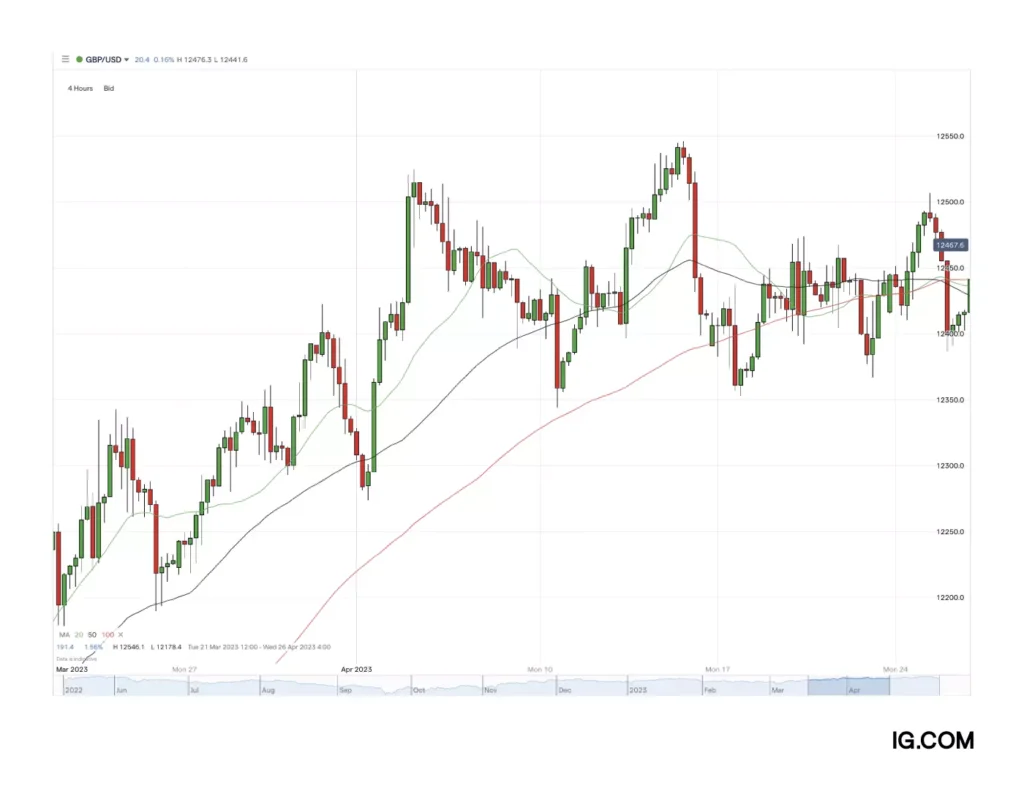
Trend-following indicators help traders determine the overall direction of the market. Popular trend indicators include:
- Moving Averages (MA) – Simple or exponential averages that smooth price data to identify direction.
- Moving Average Convergence Divergence (MACD) – Combines moving averages to signal trend shifts and momentum.
- Parabolic SAR – Identifies potential reversals with dot signals above or below price levels.
Trend indicators allow traders to enter trades in the direction of market momentum, increasing the likelihood of profitable positions.
How Do Momentum Indicators Help Traders?
Momentum indicators measure the strength and speed of price movements, helping traders identify potential reversals or continuation patterns. Common momentum indicators include:
- Relative Strength Index (RSI) – Determines overbought or oversold conditions.
- Stochastic Oscillator – Compares closing prices to price ranges over time to signal trend exhaustion.
- Commodity Channel Index (CCI) – Measures deviations from the average price to detect cyclical trends.
Using momentum indicators in combination with trend-following tools enhances timing for entries and exits.
What Are Volatility Indicators and Why Are They Important?
Volatility indicators assess how much price fluctuates over a given period, helping traders gauge risk and potential profit opportunities. Popular volatility indicators include:
- Bollinger Bands – Show price range relative to moving averages and indicate breakout potential.
- Average True Range (ATR) – Measures the average range of price movement to evaluate market volatility.
- Standard Deviation – Quantifies price dispersion around a mean to highlight potential market swings.
Understanding volatility ensures traders avoid overexposure and adapt strategies to changing market conditions.
Can Volume Indicators Improve Trade Accuracy?
Yes. Volume indicators measure market activity, showing the intensity behind price movements. Increased volume often confirms trends or signals potential reversals. Popular volume indicators include:
- On-Balance Volume (OBV) – Tracks buying and selling pressure.
- Volume Oscillator – Highlights changes in trading volume relative to a moving average.
By combining volume data with trend and momentum indicators, traders gain confirmation and reduce false signals.
How Do Traders Combine Multiple Indicators?
Traders often use multiple indicators for a comprehensive view of the market. Combining a trend indicator, a momentum tool, and a volatility measure provides insights into:
- Market direction
- Entry and exit timing
- Potential risk and reward
- Trade confirmation
This approach reduces the likelihood of relying on a single signal and enhances the probability of profitable trades.
What Are the Advantages of Using Indicators for Automated Trading?
Indicators are also integral to automated trading strategies. EAs (Expert Advisors) can use indicator signals to execute trades automatically based on predefined rules. Advantages include:
- Consistent execution without emotional interference
- Ability to monitor multiple markets simultaneously
- Automated risk management using stop-loss and take-profit signals
Automation paired with indicator analysis streamlines trading while maintaining discipline.
Are Certain Indicators Better for Short-Term Trading?
Yes. Scalpers and day traders often rely on faster indicators like:
- Short-term moving averages – Identify quick trends
- Stochastic Oscillator – Captures rapid momentum changes
- Bollinger Bands – Spot price breakouts or consolidations
Short-term indicators provide timely signals but require careful monitoring due to increased market noise.
Which Indicators Are Preferred for Long-Term Trading?
Swing and position traders often favor indicators that smooth out short-term fluctuations:
- Longer-period moving averages – Capture major trends
- MACD – Identifies long-term momentum shifts
- ATR – Adjusts position size according to volatility over time
Long-term indicators help traders hold positions confidently while reducing reaction to minor price movements.
How Do Traders Avoid Indicator Overload?
Too many indicators can cause confusion and conflicting signals. To avoid overload:
- Limit to 2–4 indicators per chart
- Ensure indicators complement each other rather than overlap
- Focus on indicators that align with your trading strategy
- Regularly review effectiveness and remove redundant tools
A streamlined setup enhances clarity and improves trading decisions.
Can Indicators Reduce Emotional Decision-Making?
Yes. By providing objective, quantifiable signals, indicators remove much of the guesswork from trading. Traders can base entries, exits, and risk management on systematic rules rather than fear or greed, increasing consistency and confidence.
How Do Traders Backtest Indicator Strategies?
Backtesting involves simulating trades using historical data to evaluate performance. Steps include:
- Apply selected indicators to past market data
- Identify signals and hypothetical trade outcomes
- Measure metrics like win rate, drawdown, and net profit
- Adjust indicator parameters for optimal performance
Backtesting provides a practical understanding of an indicator’s effectiveness and suitability for your trading style.
Are Indicators Effective Across All Market Conditions?
No. Indicators perform differently depending on whether the market is trending, ranging, or highly volatile. Trend-following indicators excel in trending markets but may give false signals during consolidation. Momentum and oscillators are better in range-bound conditions. Traders must understand market context and choose indicators accordingly.
How Do Traders Customize Indicators for Better Results?
Most platforms allow traders to adjust indicator parameters, such as:
- Period length for moving averages
- Overbought and oversold levels for RSI or Stochastic
- Standard deviation settings for Bollinger Bands
Customization ensures the indicator fits the trader’s strategy, timeframes, and risk tolerance.
What Are the Common Mistakes With Forex Indicators?
Traders often misuse indicators by:
- Relying on a single indicator exclusively
- Ignoring risk management rules
- Misinterpreting signals without considering market context
- Over-optimizing settings for past data without forward testing
Avoiding these mistakes ensures indicators remain a reliable tool rather than a source of confusion.
How Can Indicators Help With Risk Management?
Indicators can complement risk management strategies by:
- Signaling potential trend reversals for timely stop-loss adjustments
- Measuring volatility to set appropriate position sizes
- Confirming entry points to reduce chances of loss
When combined with strict risk control, indicators improve overall trading performance.
Can Indicators Be Used for Multiple Currency Pairs?
Yes. Indicators can be applied to different forex pairs to identify opportunities across markets. Traders often scan several pairs using the same indicators to spot correlations, trends, and divergences, expanding potential trading opportunities.
What Are the Advantages of Combining Technical and Fundamental Analysis?
While indicators provide technical insights, combining them with fundamental analysis strengthens trading decisions. Economic data, news releases, and geopolitical events can impact price direction, while indicators offer timing and confirmation. This hybrid approach improves probability and reduces surprises.
Conclusion: Why Indicators Are Essential in Forex Trading
Best trading indicators forex are indispensable tools for accurate market analysis. They help traders identify trends, measure momentum, gauge volatility, and confirm trade signals, enabling disciplined and informed decision-making. By combining complementary indicators, customizing settings, and practicing backtesting, traders can enhance efficiency, reduce emotional errors, and increase profitability. Whether for short-term or long-term trading, indicators provide the analytical foundation necessary to navigate complex forex markets with confidence and consistency.